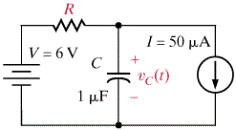
%example6p12
%visualizes
one cycle of pacemaker
%charge
cycle
tau=0.569;
tc=linspace(0,1,200);
vc=6-5.8*exp(-tc/tau);
%discharge
cycle. SCR on
td=linspace(1,1.11,25);
vcd=-22.45+27.45*exp(-(td-1)/tau);
plot(tc,vc,'bd',td,vcd,'ro'),grid,
title('PACEMAKER
CYCLE')
xlabel('time(s)'), ylabel('voltage(V)')
legend('SCR off', 'SCR on')


