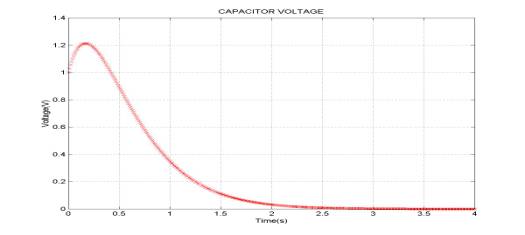
USING MATLAB TO VISUALIZE RESPONSE
%script6p9.m
%displays
the function v(t)=exp(-3t)(1+6t)
tau=1/3;
tend=ceil(10*tau);
t=linspace(0,tend,400);
vt=exp(-3*t).*(1+6*t);
plot(t,vt,'rx'),grid, xlabel('Time(s)'), ylabel('Voltage(V)')
title('CAPACITOR
VOLTAGE')


